A flowchart is a picture. A process is a system.
You can draw the most beautiful process map in the world and still not know the one thing that matters: where it breaks under real load. Boxes don't queue. Arrows don't wait. The diagram looks calm while, in reality, work piles up at the slowest step, the backlog grows, and the cost climbs.
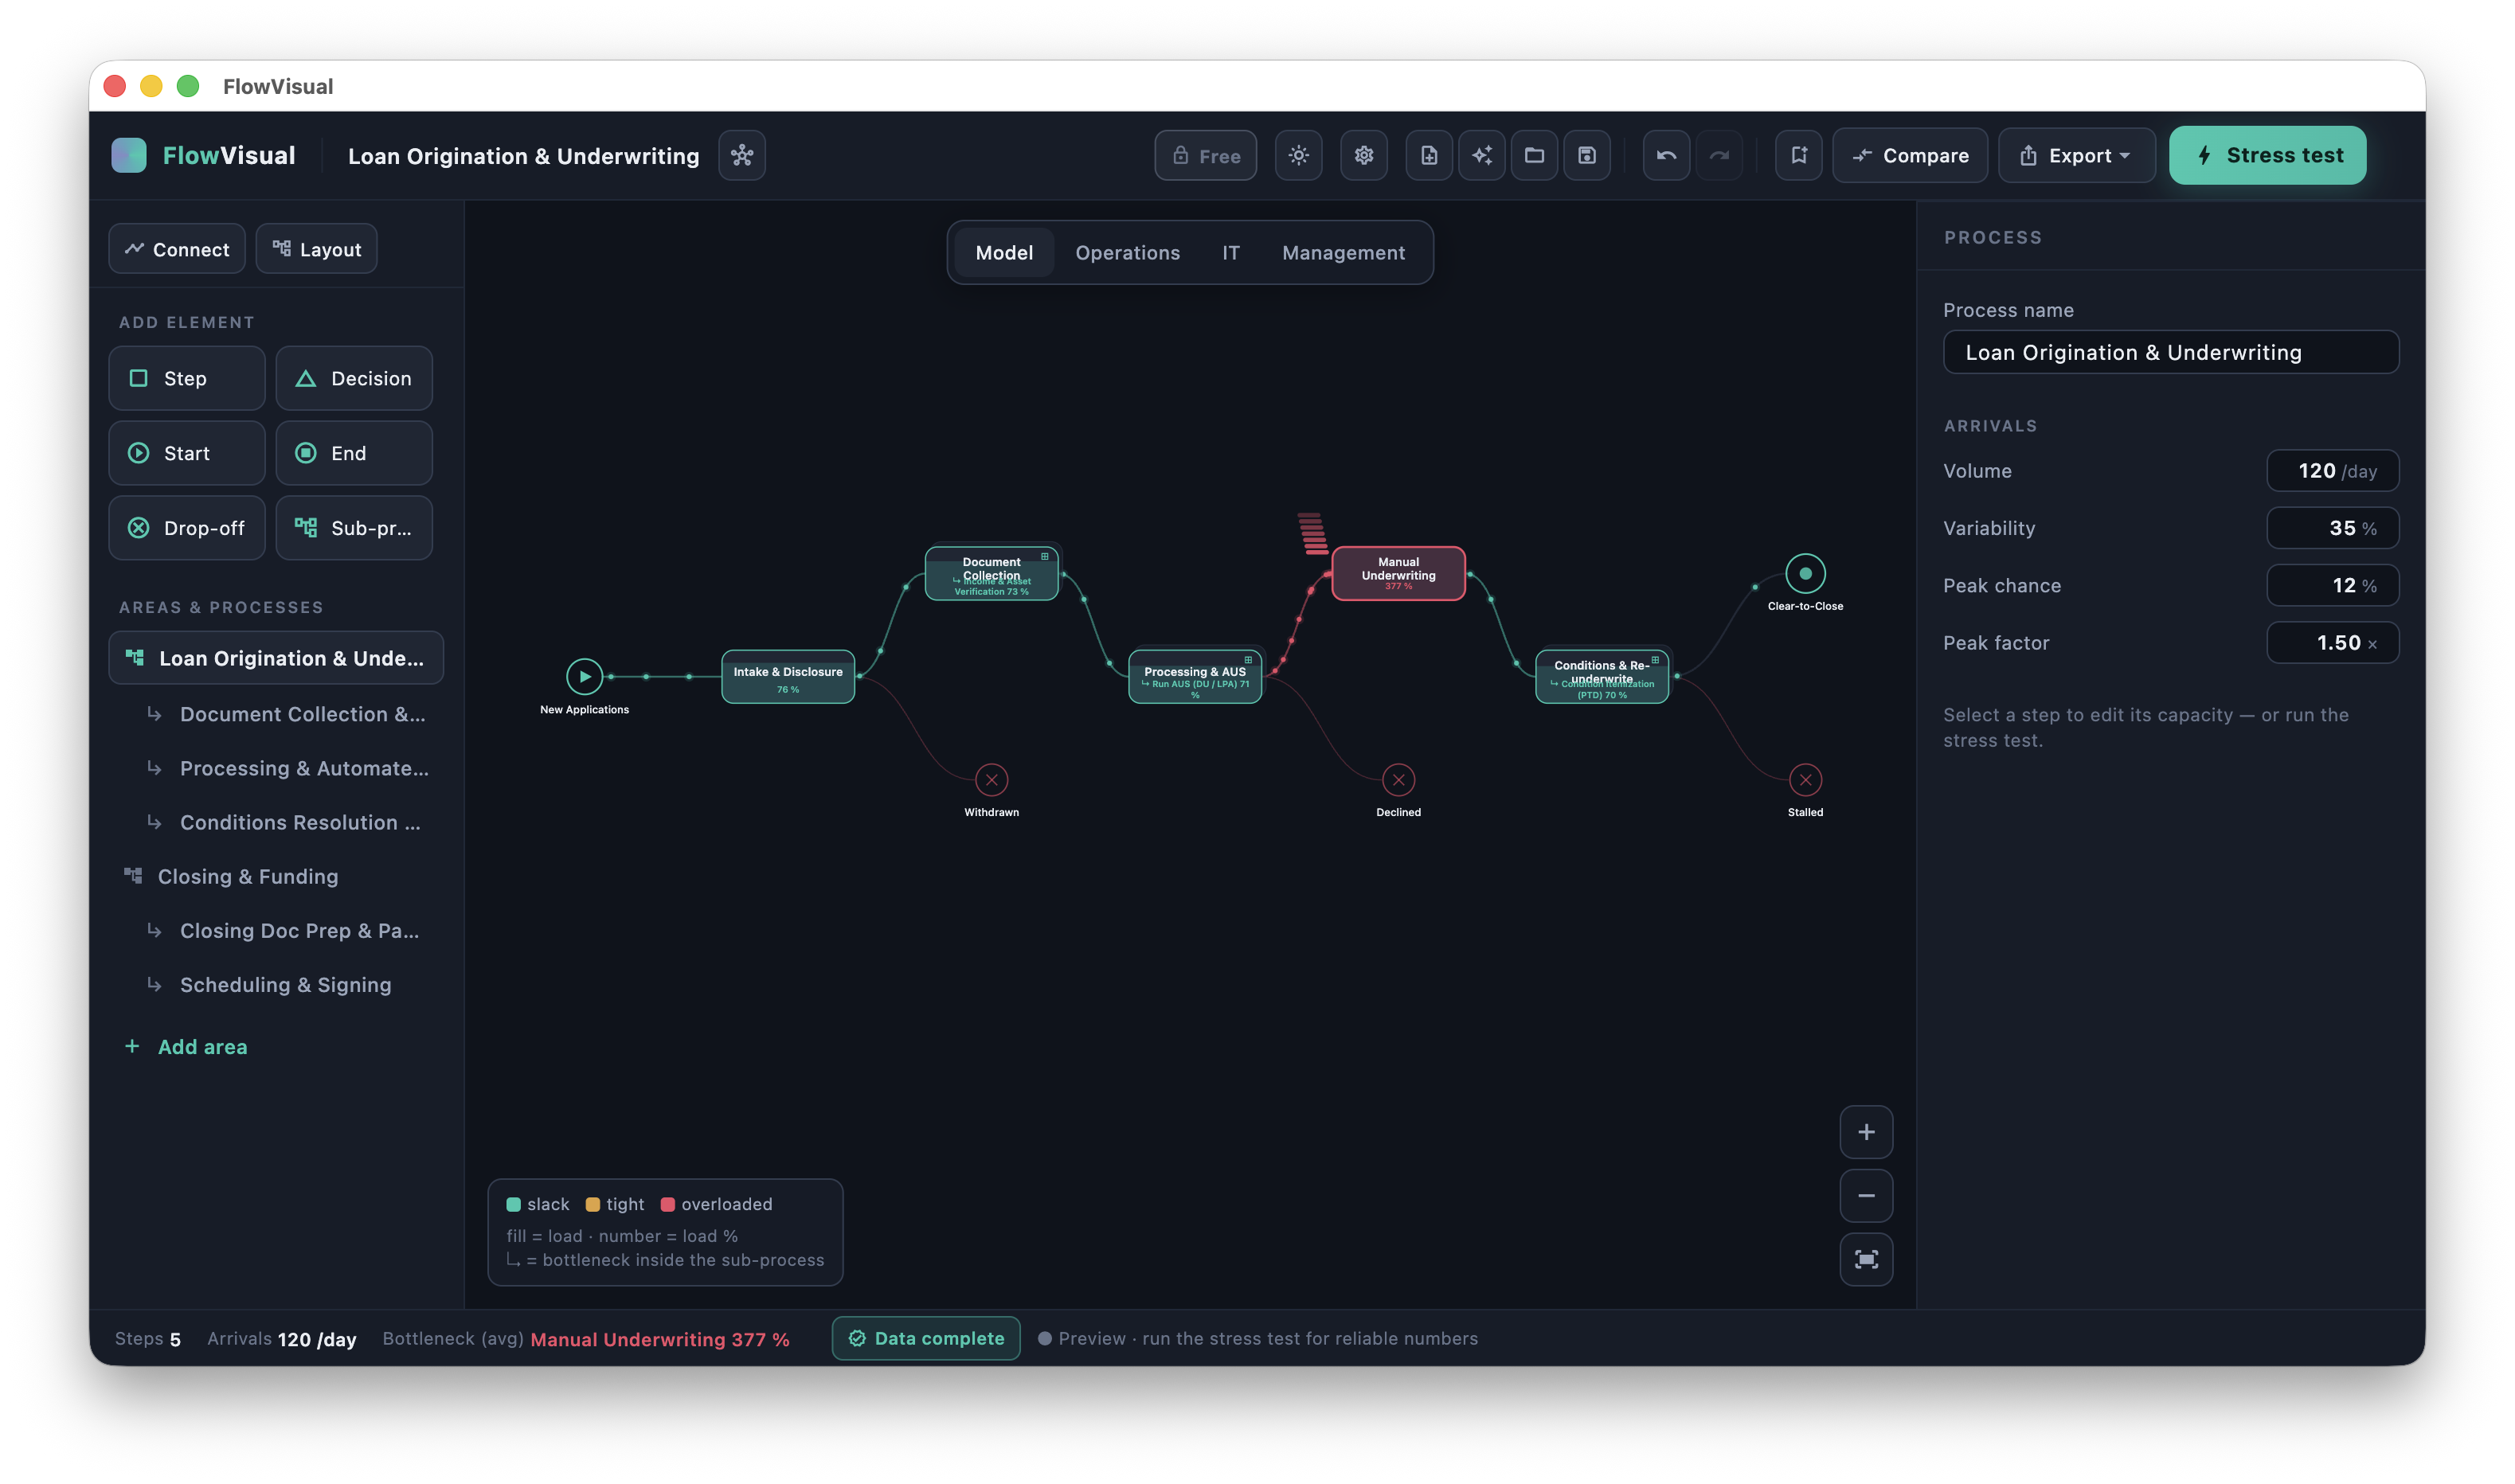
FlowVisual starts from the opposite end. You model the process from a few building blocks, hit play, and watch the workload flow through it in real time — a living twin of your operation. Where it gets tight, the node fills up and turns from teal to red. That red node is your bottleneck, on screen, before anyone has argued about it.
The one loop
FlowVisual is built around the single loop a consultant runs in every engagement:
- 01Model the as-is from elements — steps, decisions, sub-processes — with ranges instead of false precision. A step takes 5 to 10 minutes, not exactly 7.5.
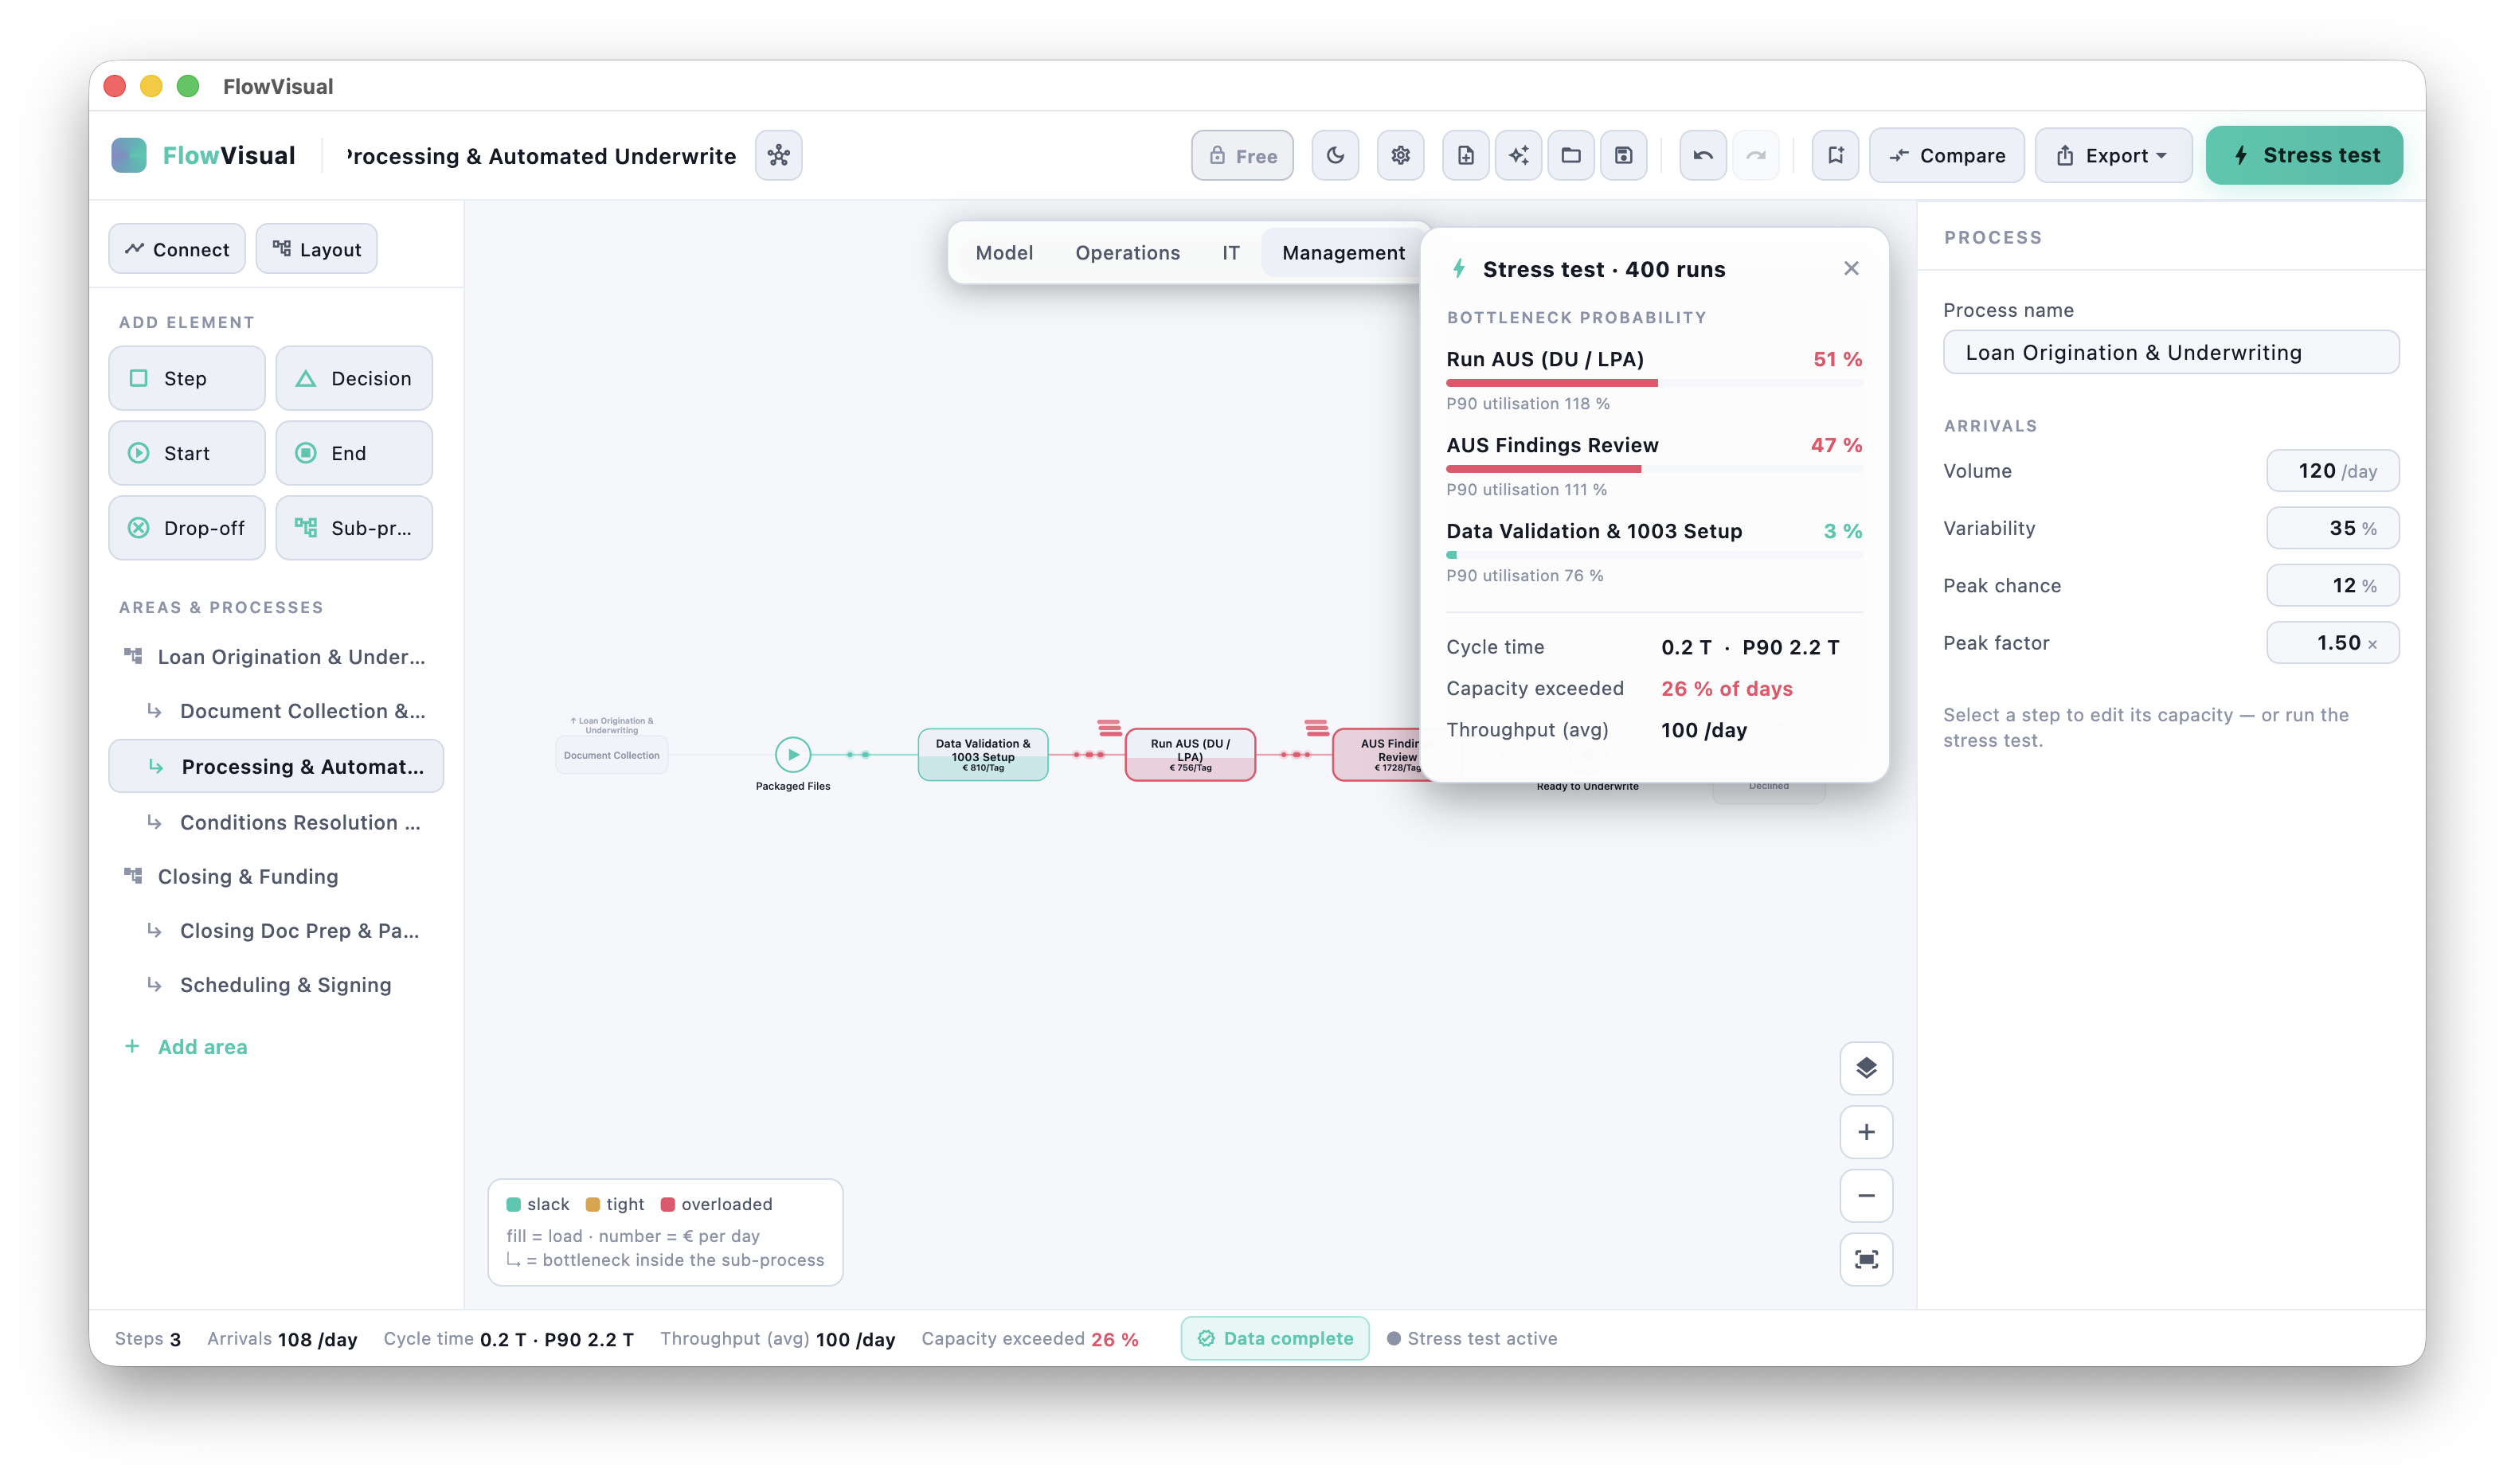
- 02Stress-test it. One click runs a Monte-Carlo simulation: hundreds of simulated days with realistic demand swings and peak spikes. Instead of one average that lies, you get the honest picture — how often each step is the binding constraint, its P90 utilisation, the spread of cycle time. The step that breaks first is ranked first.
- 03Try a fix. Add a person, automate a step, cut a service time — the model rebalances instantly.
- 04Prove it. Before vs. After in cycle time and in euros per year, every figure carried with a P10–P90 confidence band, exported as a branded PDF for your proposal or business case.
What that looks like in practice
Take a mortgage lender. Origination and Closing look like two separate teams — but only loans that clear underwriting ever reach closing. FlowVisual makes the dependency visible: six licensed underwriters can clear about 27 files a day against the ~100 that arrive. Underwriting glows red at 376% load; downstream, the entire closing and funding floor sits idle at under 55% — not because it's slow, but because it's starved.
The "aha" writes itself: staff up closing and nothing moves. Fix underwriting — or cut the condition rework that feeds it — and the whole floor lights up. That's the kind of single, defensible lever a CFO will sign off on. And because FlowVisual links the two processes, you watch the downstream team run dry as the upstream constraint bites.
Honest by design
Numbers win rooms only when they survive scrutiny. So FlowVisual is built to be defensible:
- →Ranges, not false precision. Input uncertainty flows all the way to the result, so "€142,000/year" comes with a P10–P90 band instead of a number pretending to be exact.
- →Probabilities, not gut feel. The bottleneck is ranked by how often it actually binds across hundreds of simulated days.
- →Provenance. Every value can be read in three lenses — the process, the people (load per role), the systems (and the automation potential in euros) — so it's always clear where a figure comes from and how much weight it can hold.
Local. No cloud. No sign-up.
Your process models never leave your machine. No account, no upload, no AI at runtime — files live on your own drive, local or a shared SharePoint folder, so a colleague opens the same project from the same place. Nothing to clear with IT.
Who it's for
Process and management consultants, in-house optimisers and operations leads — anyone who has to walk into a room and defend "this change is worth €X" in front of people who will push back. The lively app is your tool; the branded PDF is what the client keeps.
Public Beta — Windows & macOS
FlowVisual is in public beta. The downloads for Windows and macOS are landing in the next few days. The app is free for modelling and stress-testing; a 14-day trial unlocks the full output (save, share, branded PDFs), and a yearly licence starts at €99 for three seats.
See features, screenshots and the download on the FlowVisual app page.
