FlowVisual
Simulate processes, find the bottleneck, prove the fix in euros.
FlowVisual is a desktop simulator for process consultants: model a process from elements, watch it run live, let a Monte-Carlo stress test expose the bottleneck, and prove the improvement in € and time via what-if — as a branded PDF for your proposal or business case. Ranges instead of false precision (5–10 min, not 7.5), probabilities instead of gut feel, every € figure with a P10–P90 band. Runs locally, no cloud, no sign-up — files on your own drive. Windows & macOS.
Business customers only
14 days free, then €99 / year. Cancel anytime.
All prices are net, plus VAT.
Secure payment & invoice via Lemon Squeezy. Billed in EUR — your bank handles the conversion. License key arrives by email.
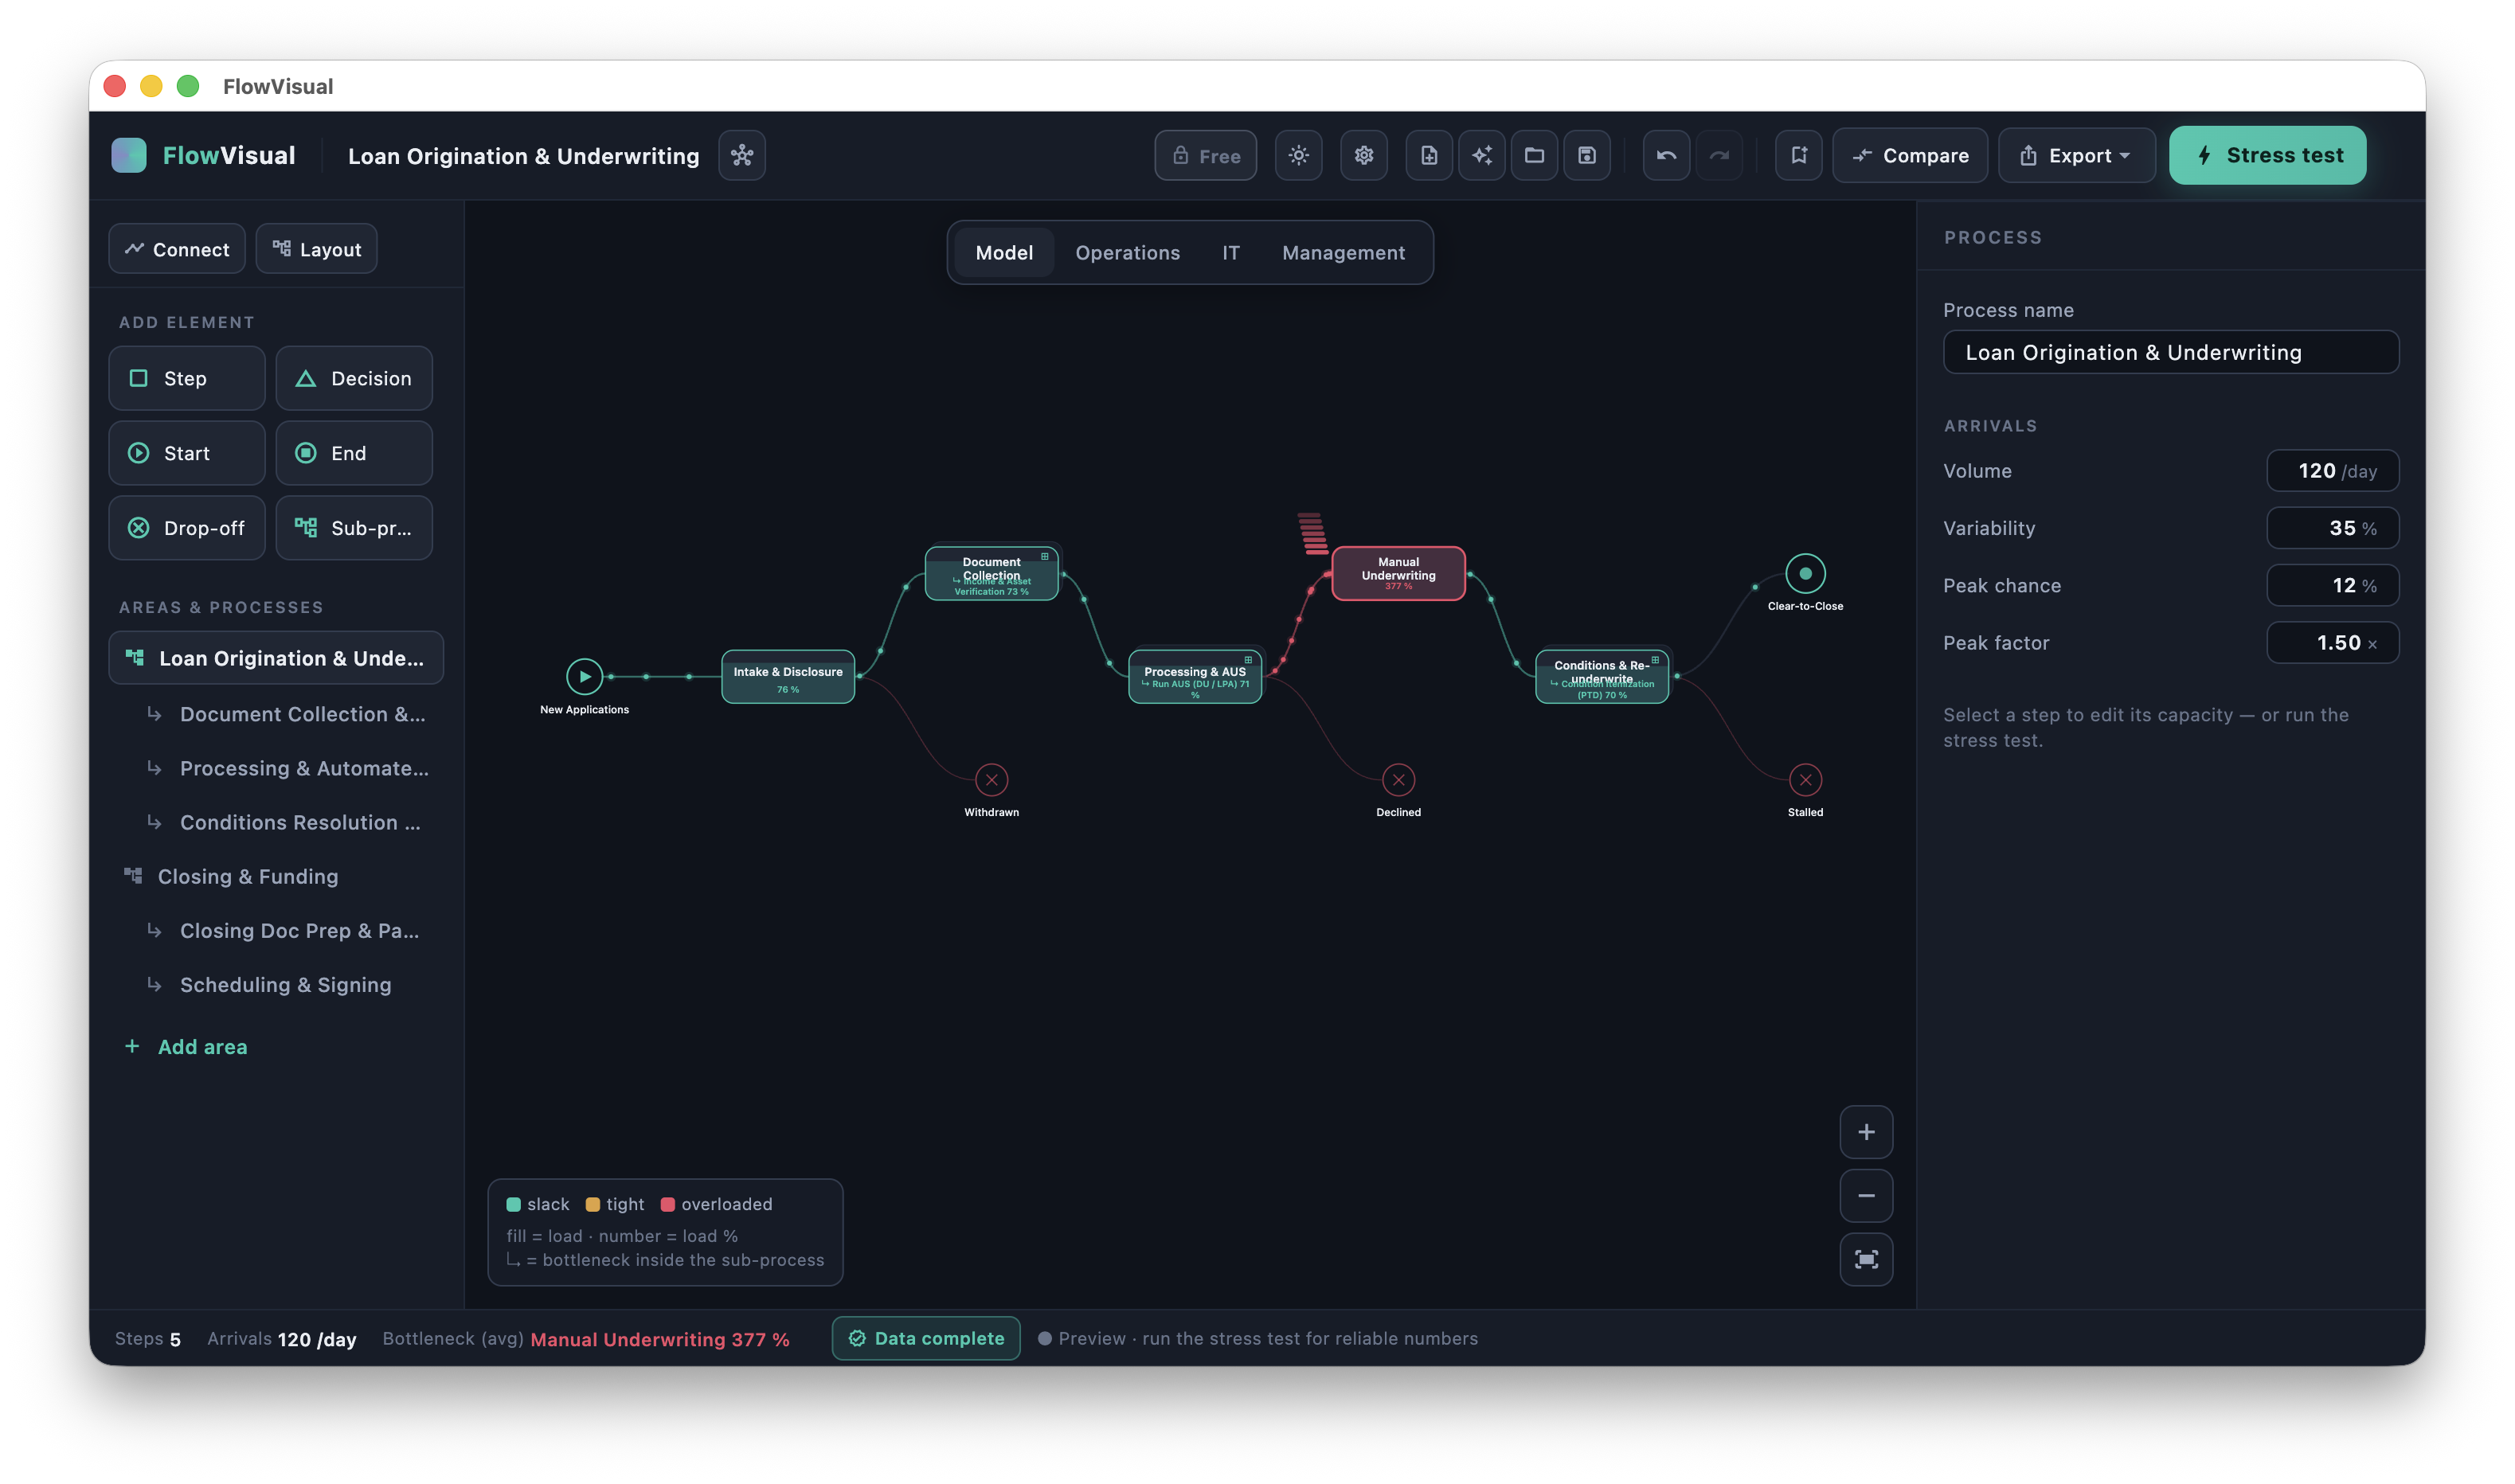
Most tools let you draw a process. FlowVisual lets you run it.
A flowchart just sits there. A real process breathes — work piles up at the slow step, the queue grows, the cost climbs. FlowVisual is a desktop simulator that makes that visible: you model the process from a few building blocks, hit play, and watch the workload flow through it in real time. Where it gets tight, the node fills up and turns from teal to red. That red node is your bottleneck — and now you can prove what fixing it is worth.
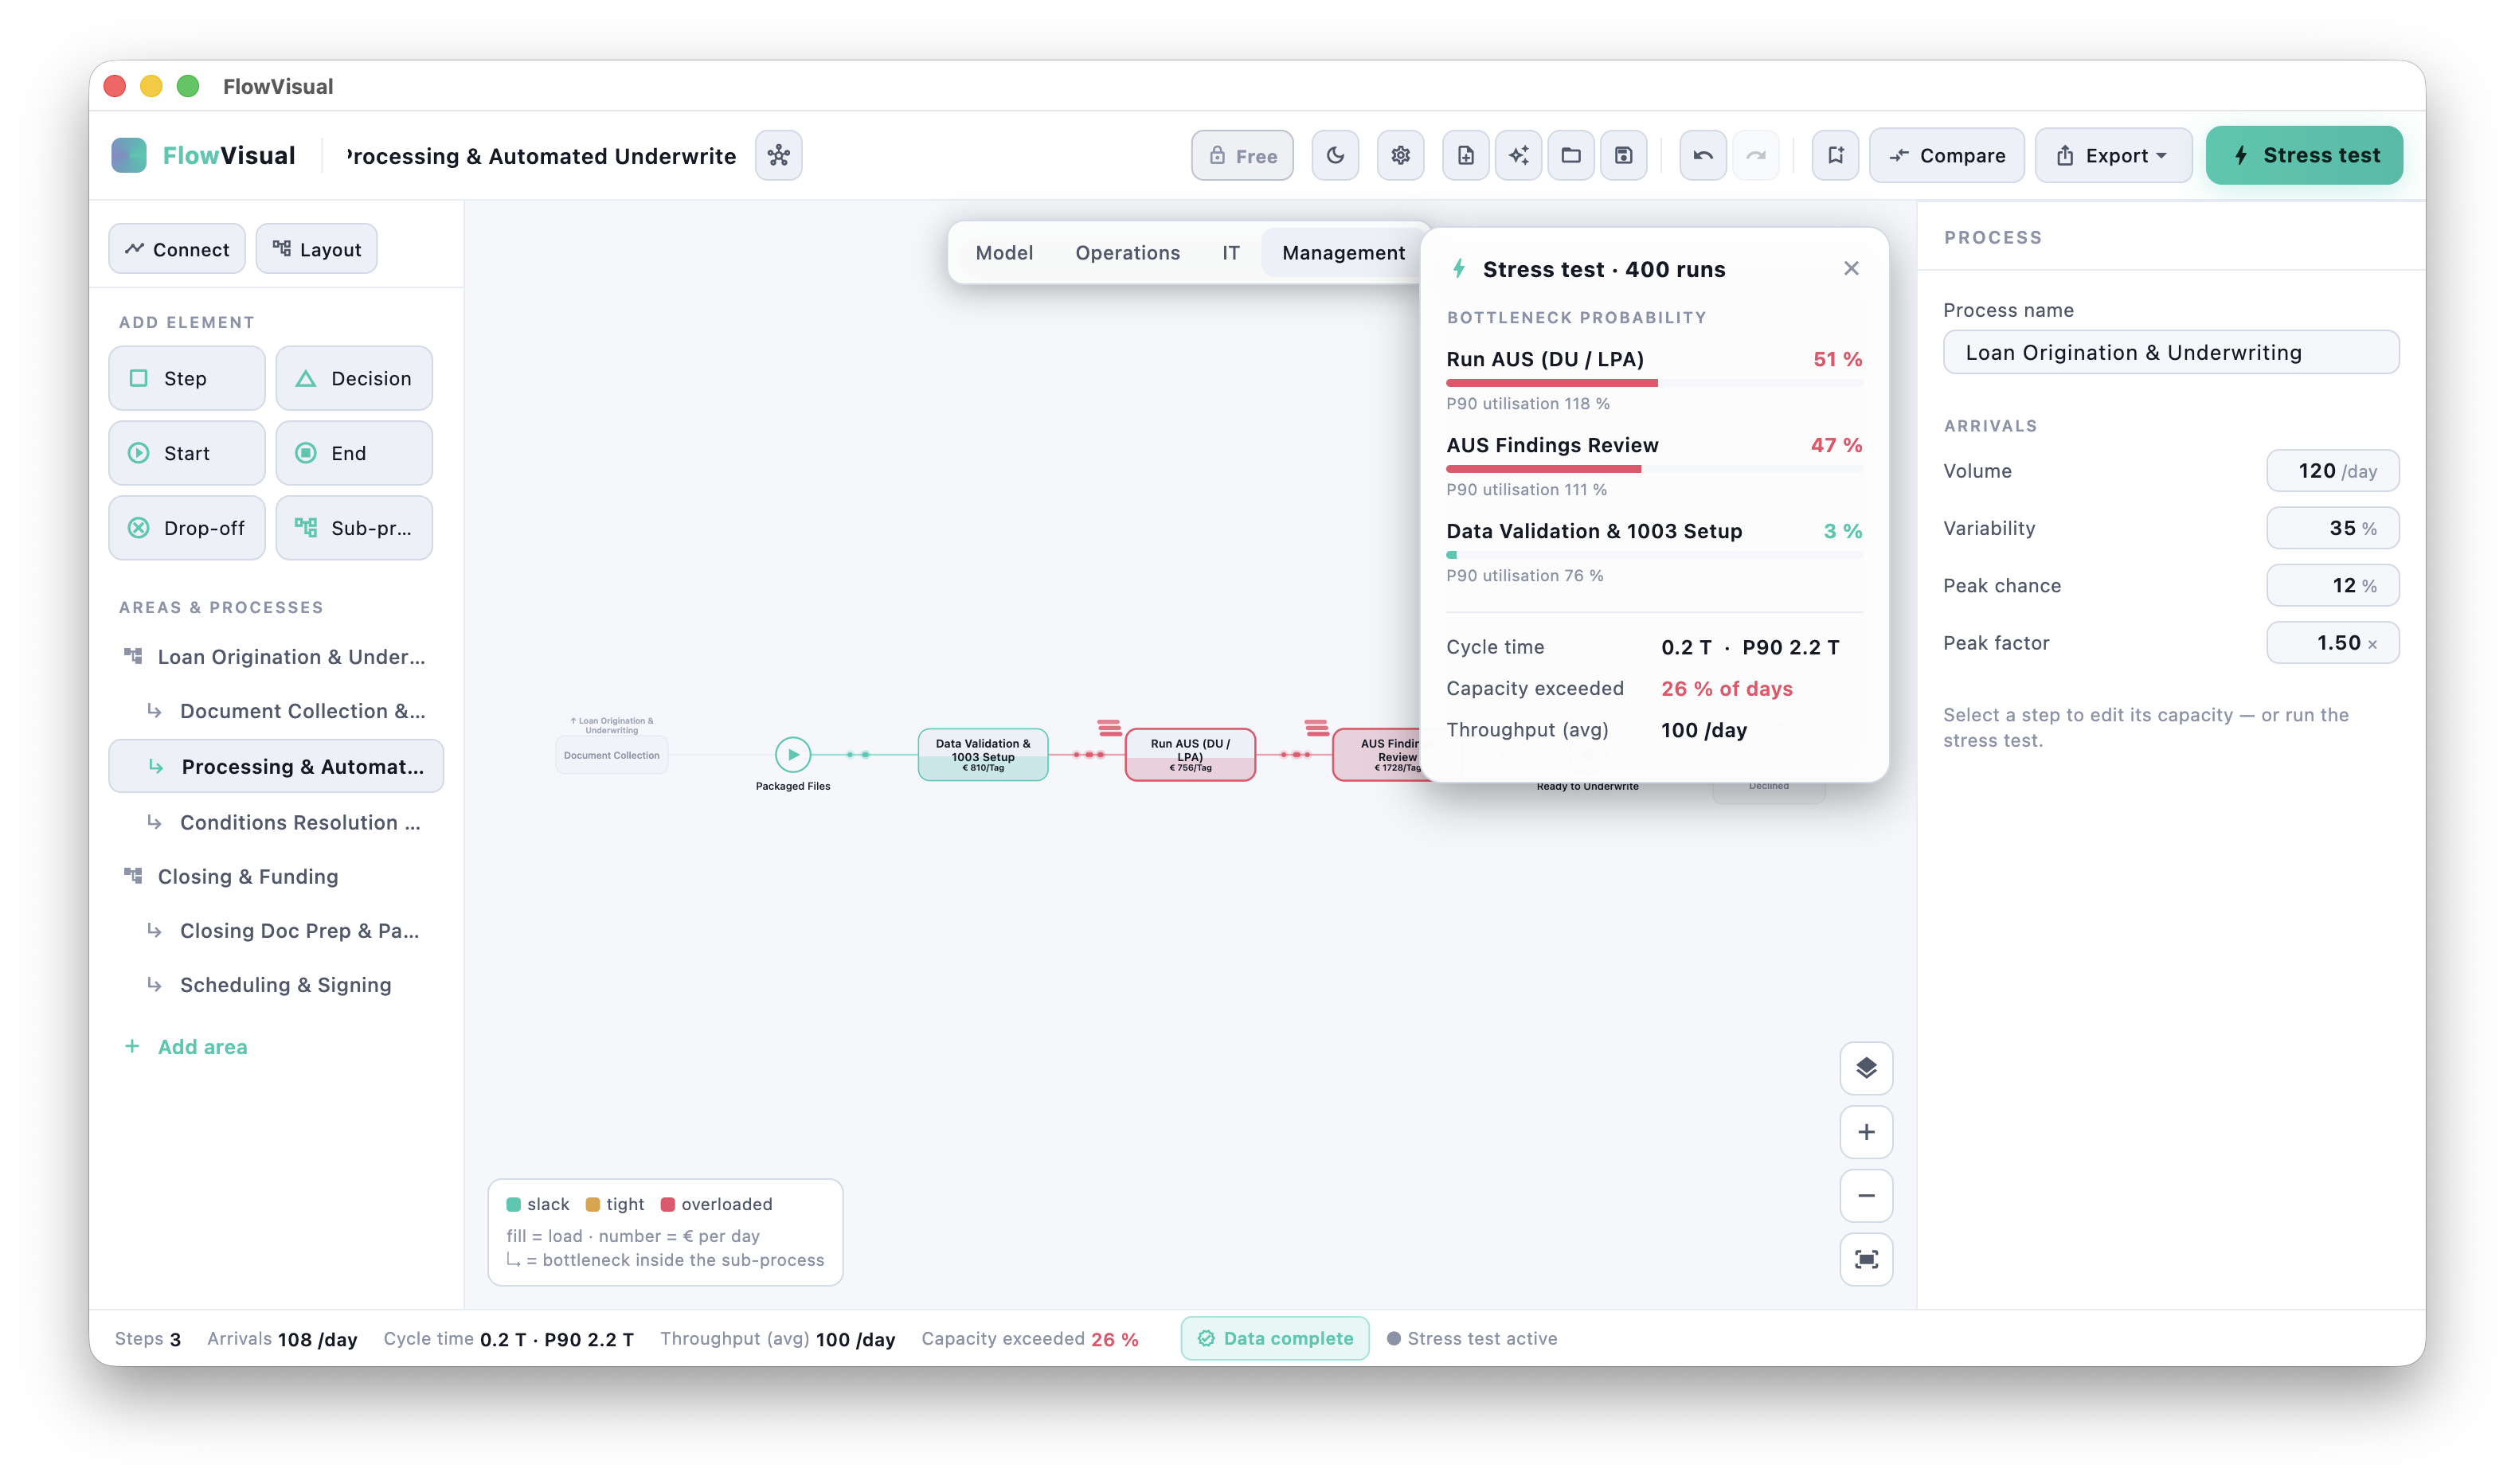
Find the breaking point — with probability, not gut feel
One click runs a Monte-Carlo stress test: hundreds of simulated days with realistic demand swings and peak spikes. Instead of one average that lies, you get the honest picture — how often each step is the binding constraint, its P90 utilisation, the spread of cycle time. The step that breaks first is ranked first. No more arguing about where the problem is.
Prove the fix in euros — with a confidence band
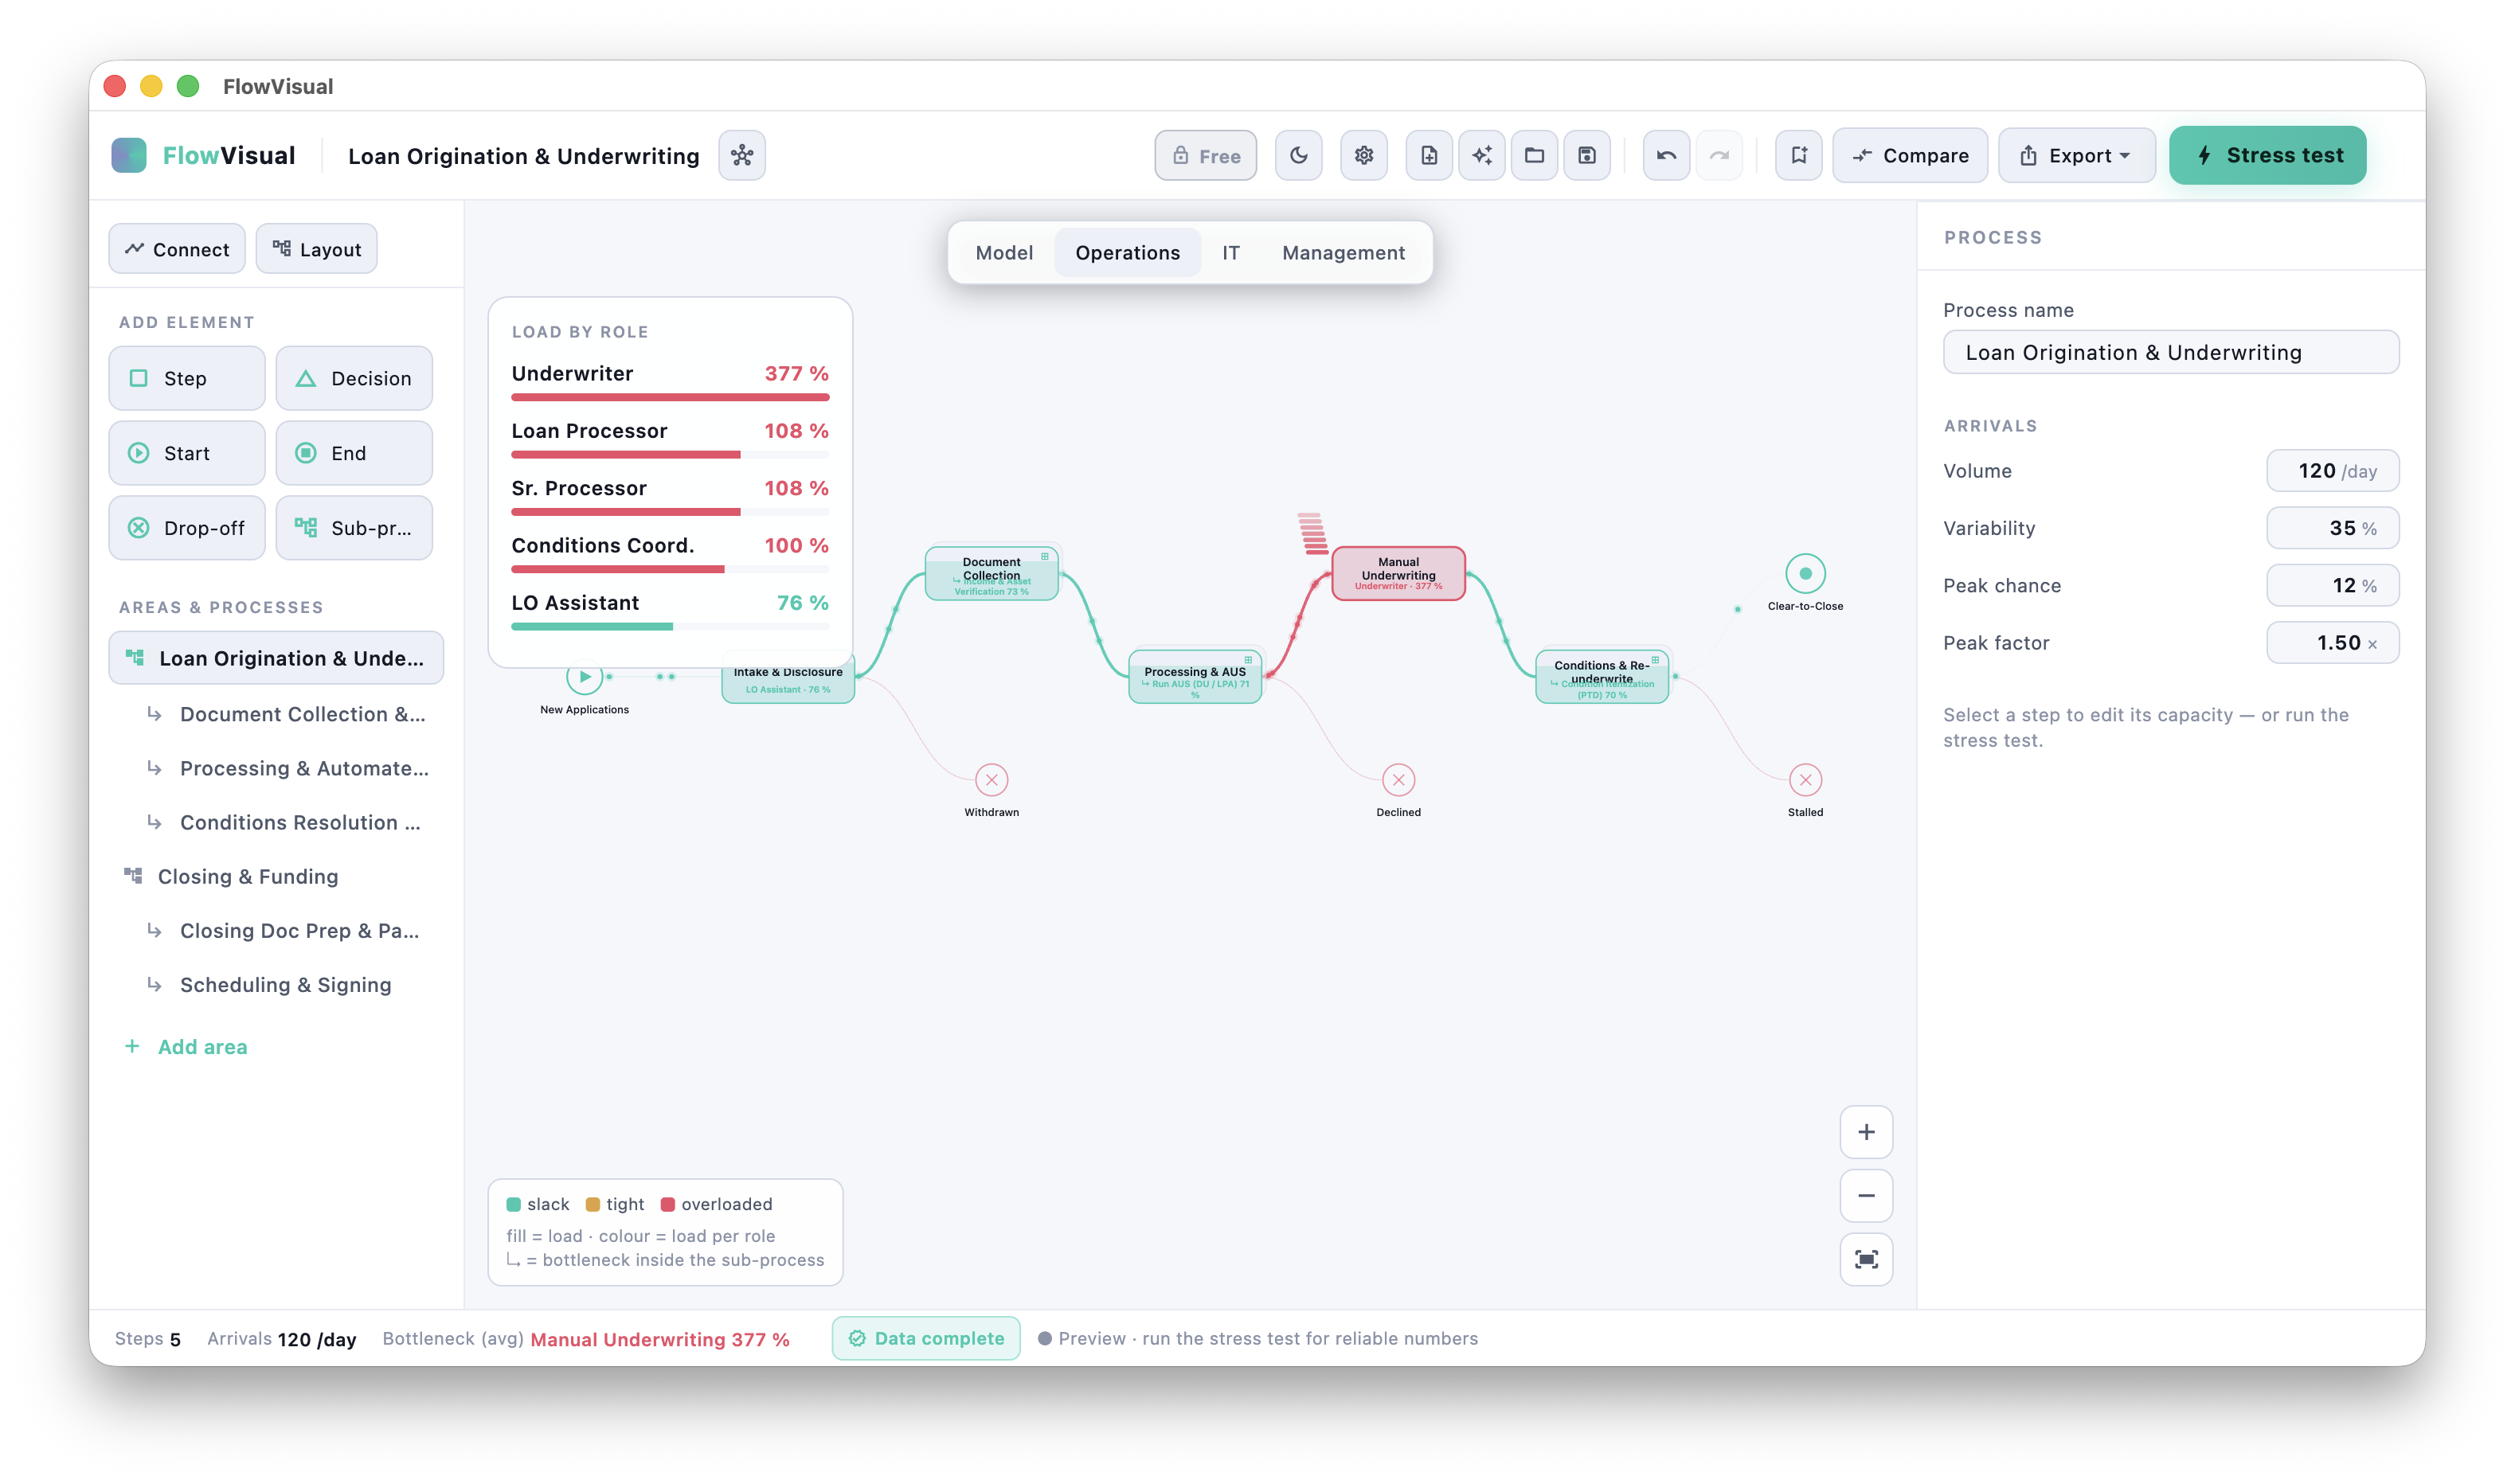
Change a number — add a person, automate a step, cut a service time — and the model rebalances instantly. Then see the payoff: Before vs. After in cycle time and in euros per year, every figure carried with a P10–P90 band so you never hand a CFO a false-precision number. That's the difference between "trust me" and "here's the math."
Model the whole landscape, not just one box
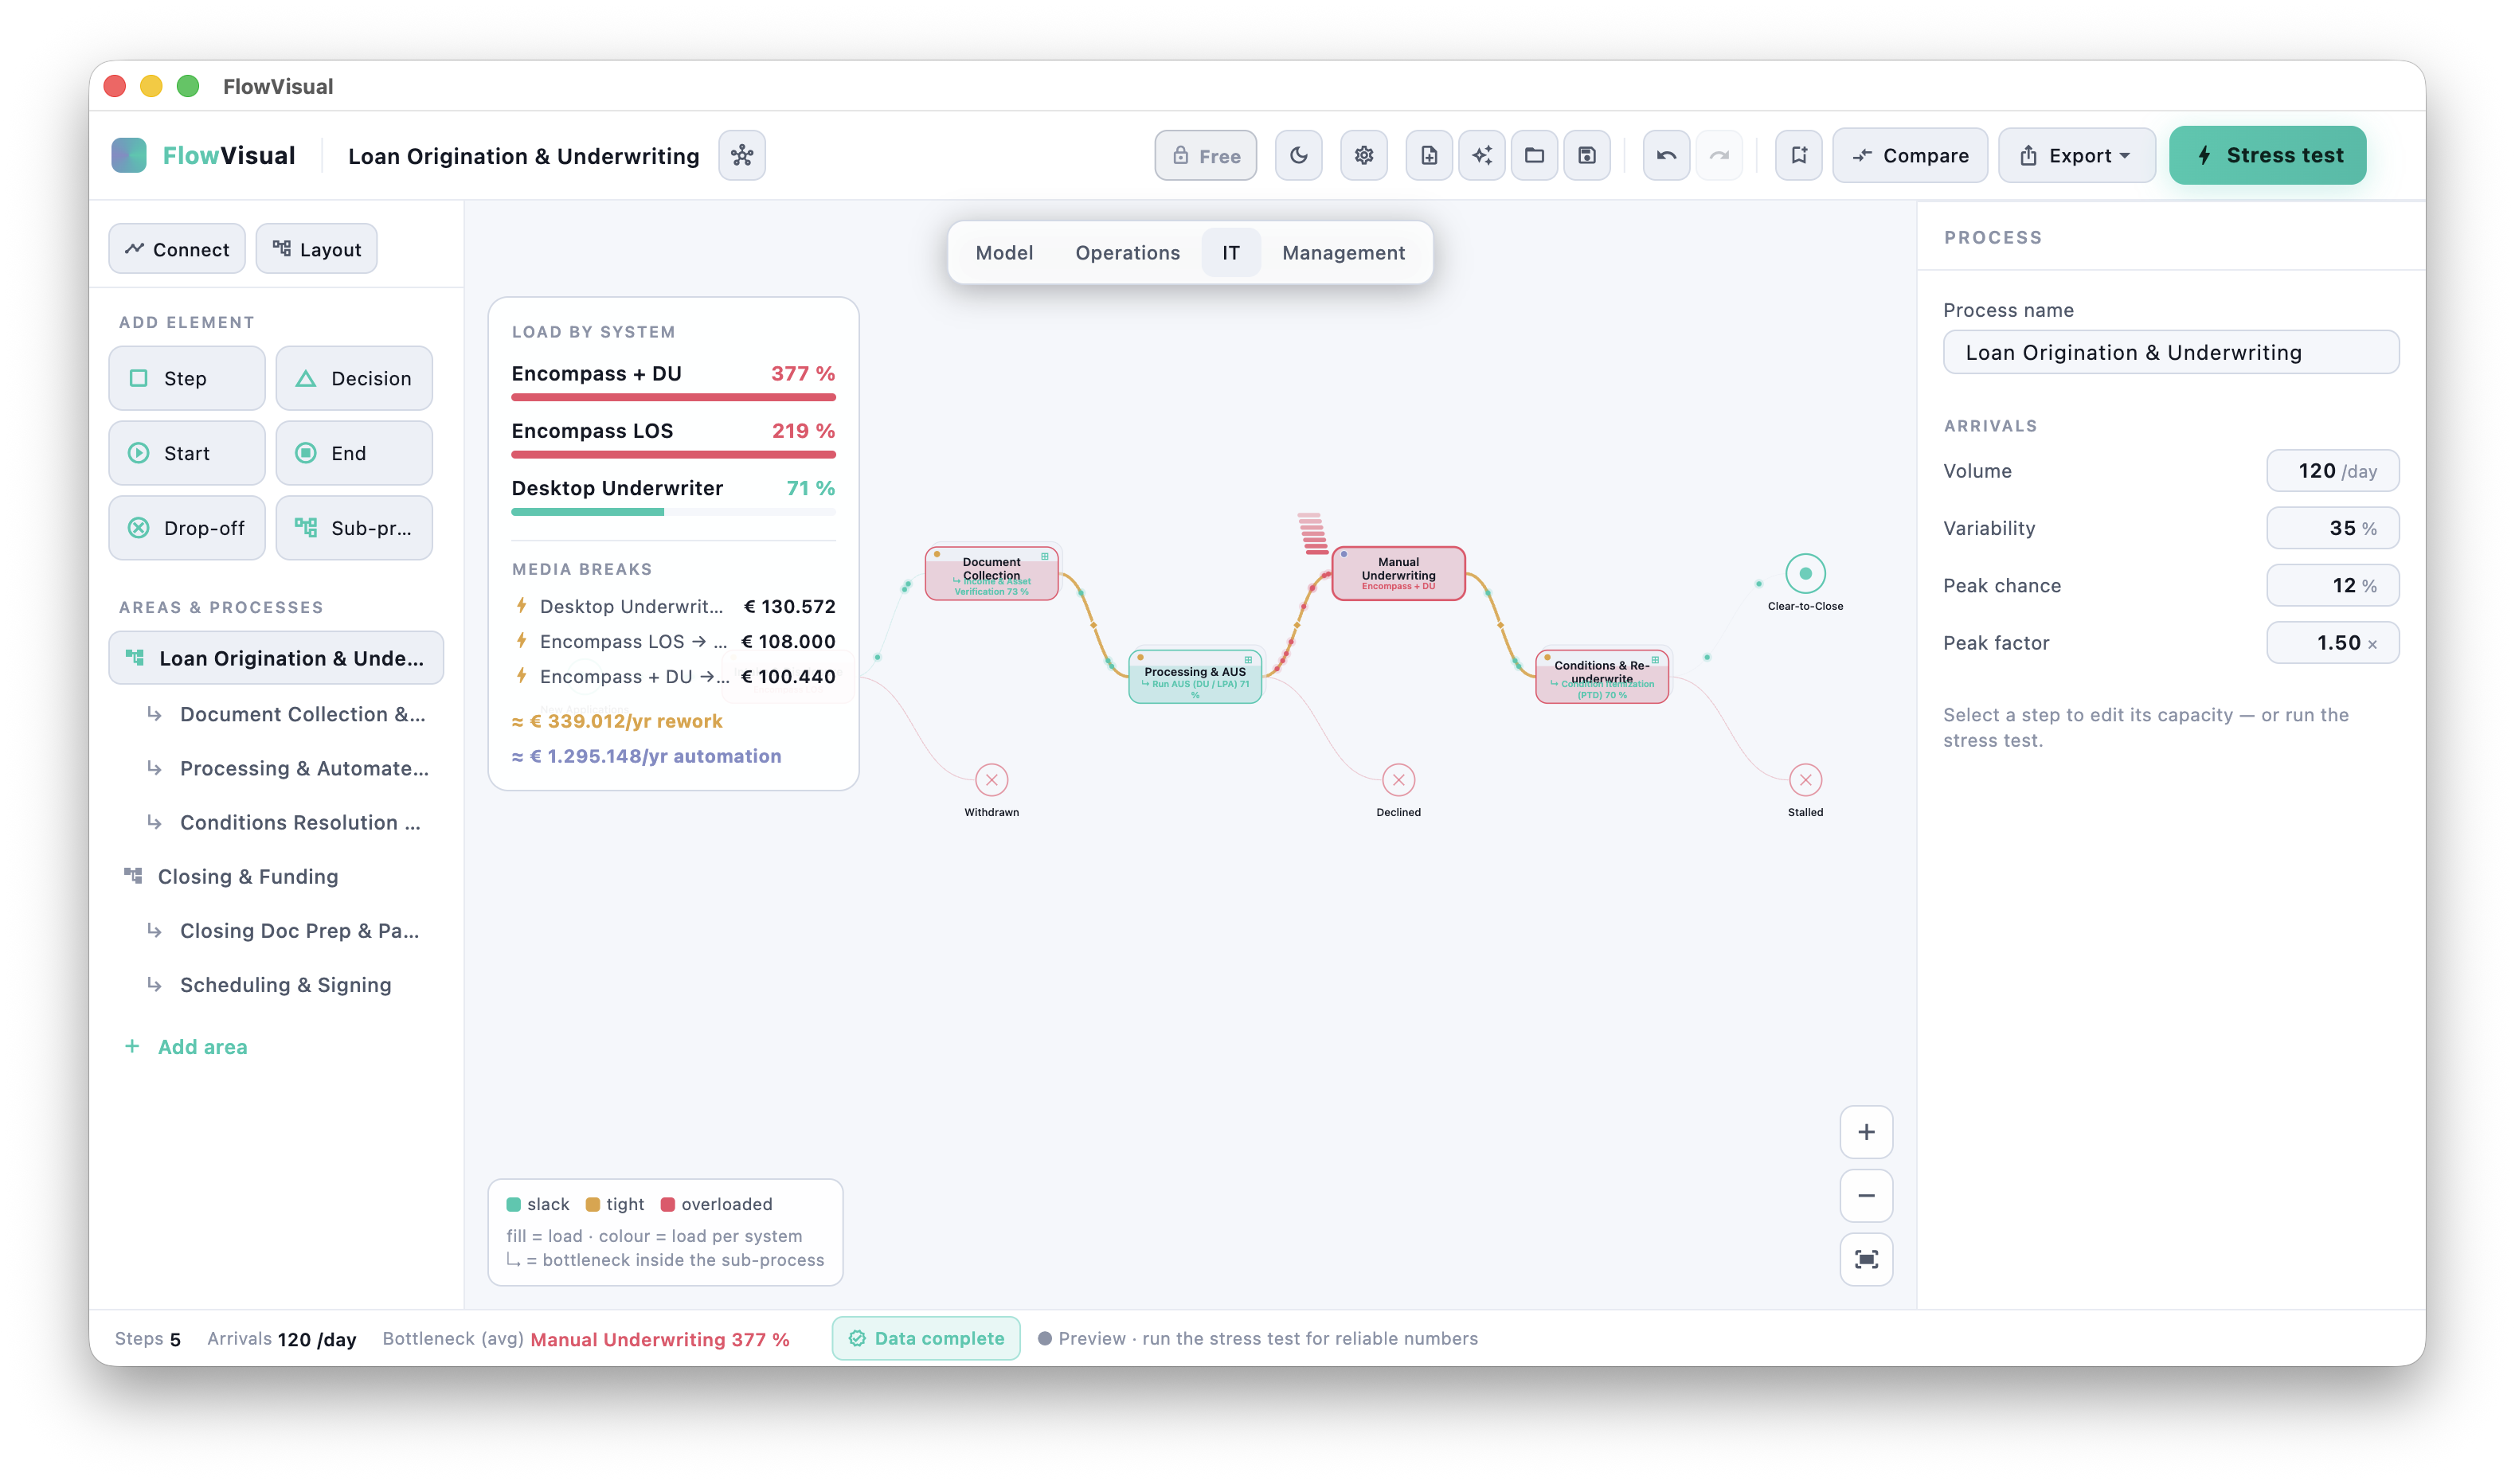
Real work doesn't live in a single diagram. Link processes so one feeds the next — when an upstream bottleneck throttles output, you watch the downstream process starve, live. Drill into any step to model its sub-process. The depth is there when you need it; the view stays clean when you don't.
Ranges, not false precision
A step doesn't take exactly 7.5 minutes — it takes 5 to 10. FlowVisual lets you say that, and the simulation carries that uncertainty all the way to the result. Every value can be tagged by where it came from, so it's always clear how much weight a number can hold. That honesty is what makes the output defensible in the room.
The deliverable does the selling
Export a branded PDF — your logo, the customer's letterhead, the € business case, the before/after, the process documentation. What your client keeps is sober, precise and decision-grade. The lively app is for you; the PDF is for them.
Fully local. No cloud, no sign-up.
Your process models never leave your machine. No account, no upload, no AI at runtime — files live on your own drive, local or a shared SharePoint folder. Nothing to clear with IT.
Who it's for
Process and management consultants, in-house optimisers and operations leads — anyone who has to walk into a room and defend "this change is worth €X" in front of people who will push back.
How it works
- Model your process from elements — or start from the built-in example.
- Run the stress test; find the bottleneck.
- Try a fix; watch it rebalance.
- Export the before/after business case as a branded PDF.
Start with a 14-day free trial, then an annual subscription for 3 seats — cancel anytime. Windows & macOS.
Screenshots
Frequently asked.
Does FlowVisual run on Windows too?
Yes. On Windows, FlowVisual lives in the Microsoft Store — installed from there it skips the SmartScreen dialog and updates itself. If you don't use the Store, the same build is available as a signed direct installer here.
Tech stack
- Flutter
- Dart
Platforms
- macOS
- Windows
Tags
- Consulting
- Process Simulation
- Operations
Articles about this app.
- №01│August 15, 2026
BalaneDisk and FlowVisual are in the Microsoft Store
BalaneDisk and FlowVisual are now in the Microsoft Store, WindowNote follows. No SmartScreen dialog, updates from there. The installer stays.
→ Read article - №02│August 5, 2026
August Update 2026: a chess game, an X-ray of your machine, and three Odoo modules
Four weeks after the summer update: Chessplosion 1.0 for the Mac, BalaneDisk in public preview, Balane Desk and usable.software in the works, three free Odoo modules — plus updates for WindowNote and FlowVisual.
→ Read article - №03│July 5, 2026
Summer Update 2026: five apps sharpened, two new projects
Not a single launch but a batch: FlowVisual, Ausklang, SynapseGym, TextDeck and GridBar all got a round of updates — and two new projects join in, both about the same question: what AI actually costs.
→ Read article - №04│June 25, 2026
Process Documentation Software: 7 Tools Compared Honestly (2026)
Which process documentation software actually fits? 7 tools from Confluence and draw.io to Signavio and FlowVisual — compared on what matters: keeping docs current, versioning, simulating.
→ Read article - №05│June 25, 2026
Process Documentation: The Complete Guide (Methods, Template, Tools)
Process documentation that doesn't rot in a folder: what it is, which elements belong in it, which method fits when, and how dead docs become a living process model. Includes a template and a tool comparison.
→ Read article - №06│June 25, 2026
Introducing FlowVisual: simulate your process, find the bottleneck, prove the fix in euros
Most tools let you draw a process. FlowVisual lets you run it — a desktop simulator that exposes the bottleneck with a Monte-Carlo stress test and proves the improvement in euros and time. Public Beta for Windows & macOS.
→ Read article - №07│June 25, 2026
How to Document a Process: Step-by-Step Guide with Template
How to document a process in 6 steps — with a copy-paste template, a concrete example, and the mistakes that kill any documentation. From capture to a living model.
→ Read article - №08│April 23, 2026
Value Stream Mapping: step-by-step guide with example (incl. software comparison)
Value stream mapping step by step: what it is, how to build one (with a concrete example), which metrics matter, and which software is worth it for consultants and Lean teams.
→ Read article - №09│April 23, 2026
Process Modeling Software for Mac: 9 Tools Worth Testing in 2026
Every honest comparison of process modeling software for Mac — Visio alternatives, Lucidchart alternatives, simulation tools, BPMN editors. What actually works on macOS in 2026.
→ Read article - №10│April 23, 2026
Two Public Betas: FlowVisual & Screenrig
Two new Mac apps from the Balane workshop go into public beta — and why we built both against the cloud reflex.
→ Read article


Legal.
Purchase and payment are handled by Lemon Squeezy as Merchant of Record (the legal seller). Their terms and refund policy govern the purchase; use of the software is governed by the license agreement below. Lemon Squeezy buyer terms.